


The British Constructional Steelwork Association (BCSA) has produced design guidelines for five common types of building using the project Target Zero. This describes how the designer can develop an energy-neutral building. This page provides a summary of the design guideline for a distribution centre.
Assumptions
The design guidelines examine energy, expressed in kg of CO2 emissions, in two areas:
The energy in the use phase is the energy used for heating, cooling, lighting and ventilation of the building: the building-related energy. In addition the building also uses energy for IT and all types of apparatus such as refrigerators and microwave ovens: the use-related energy. As a rule of thumb this is about +20% energy.
The energy for materials is the energy used for production, transport, assembly, demolition and recycling of building materials: the material-related energy.
The first action needed to achieve an energy-neutral building is to investigate how the building-related energy can be minimised and compensated. This is also the focus of the UK Building Regulations, in 2010 Part L. This includes the following requirements for the years from 2010:
Reference Building
The reference building is the Pro-Logis distribution centre in Stoke-on-Trent in the United Kingdom (see image). The distribution centre has a surface area of 34,000 m2 with an office of 1,400 m2. The columns in the facade are 8 m centre-to-centre and the middle columns 16 m c.t.c.
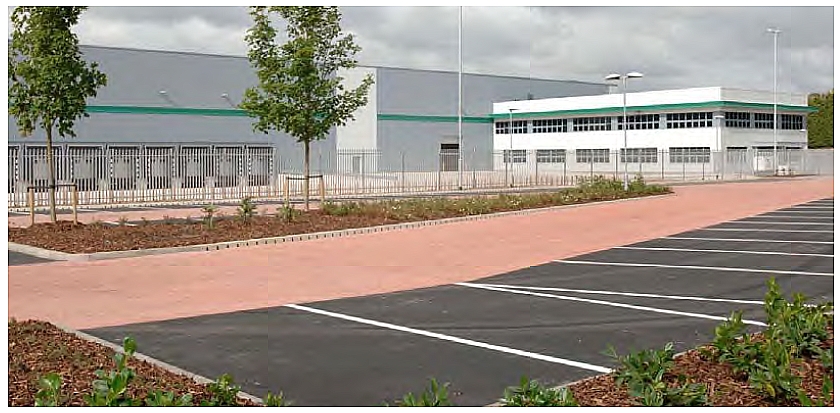
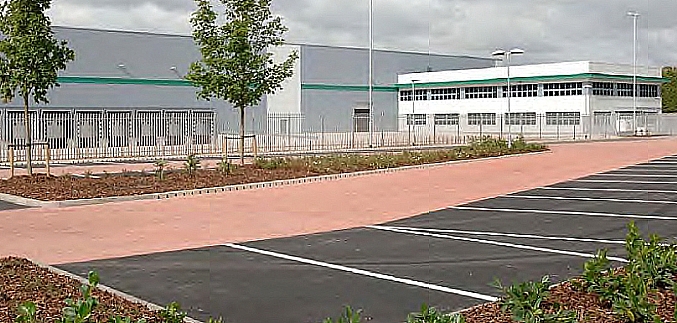
The Pro-Logis distribution centre in Stoke-on-Trent serves as a reference building.
| Part | U value (W/m2K |
| facades | 0.35(Rc = 2.68) |
| ground floor office | 0.25 (Rc = 4) |
| distribution centre ground floor | 0.07 (Rc = 14.2) |
| roof | 0.25 (Rc = 4) |
| doors | 2.2 |
| transport doors (overhead doors) | 1.5 |
| rooflights | 1.8 |
| airtightness | 7 m3/hour per m2 50 Pa |
| thermal bridges | 0.35 W/m2K |
Physical parameters of the reference building (distribution centre)
Distribution of energy use in reference building (distribution centre)
The distribution of energy use is shown in the pie chart below. Lighting takes the largest share of the energy consumption (73%), followed by heating of the building (11%). Hot water (0%) and ventilation (1%) are barely relevant. The use-related energy (14%) is not considered. The distribution centre is not cooled.
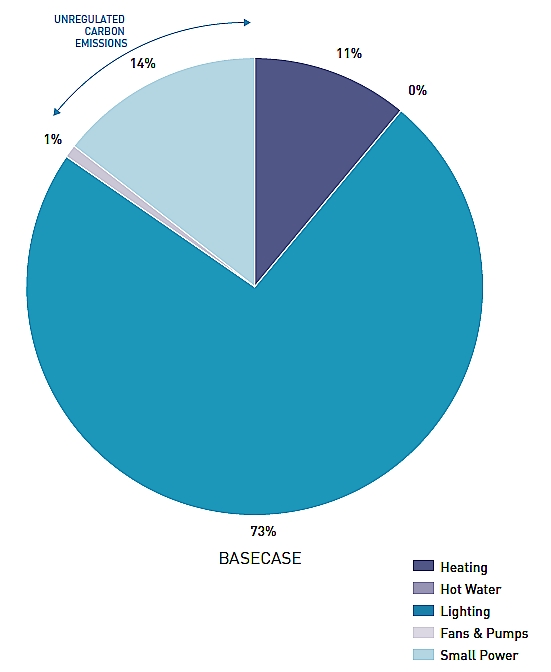
Distribution of energy consumption in reference building in accordance with Building Regs. 2006 Part L
Energy saving measures
The table below shows the CO2 savings seen from over twenty energy saving measures. Remarkably, highly efficient lighting alone can give savings of more than 30%. Furthermore, with skylights it is possible to make a saving of 25-30%. In addition, the saving is the net result of the savings made on lighting and the additional heating, owing to the fact that the U-value of the windows is lower than that of the closed parts. Finally, the figure shows that all measures providing higher insulation values produce very limited savings.
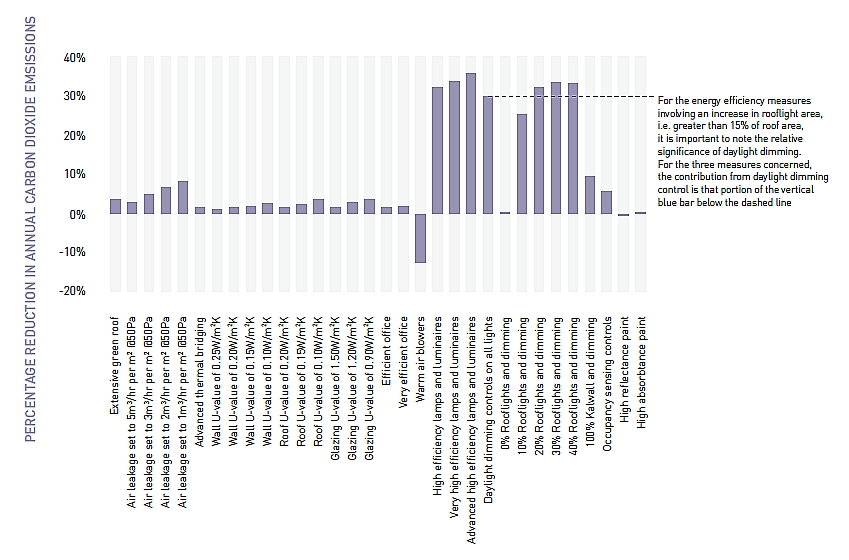
Effect of energy-saving measures on CO2 emissions.
The various energy saving measures are placed in packages A, B and C (see table below), where A is the least and C the most comprehensive package. For each package the table shows CO2 emissions and percentage saving on CO2 emissions. In addition, based on LCC (Life Cycle Costing), the savings in initial investment and cost savings after 25 years are given. These savings include capital costs and maintenance.
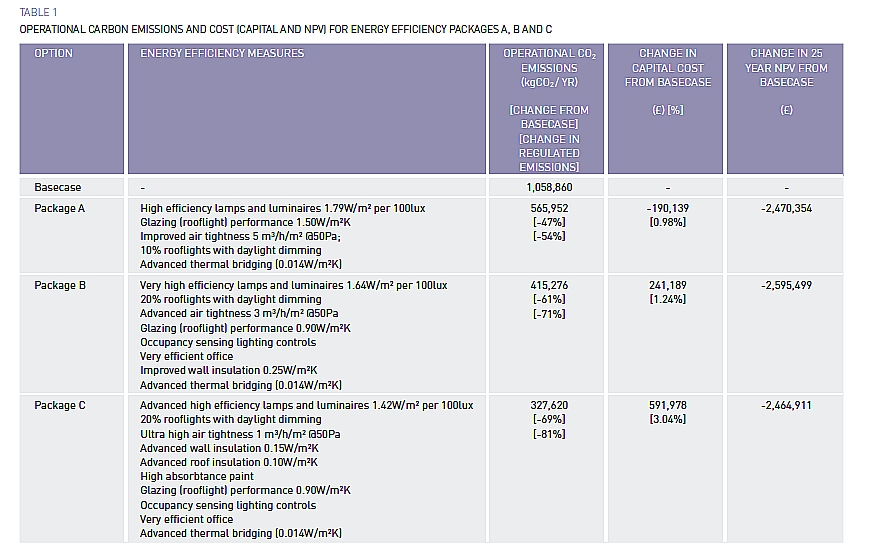
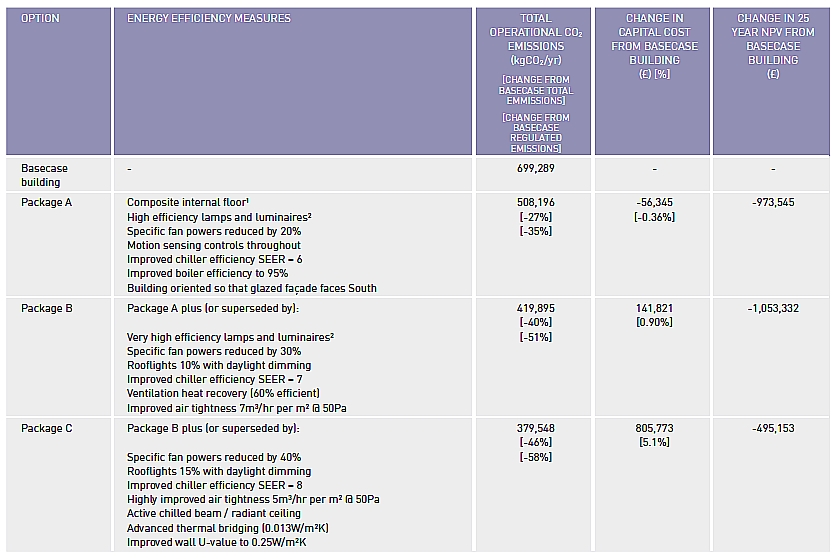
Energy saving and cost saving from the energy saving measures of packages A, B and C.
The table shows the saving on the initial investment (middle column) and additionally (last column) the savings over a period of 25 years. These savings include capital costs and maintenance. Package A gives a saving on investment costs of 0.98% and provides a saving of 973.545 over 25 years - a good investment. Furthermore it can be see that an extra investment of 3.04% gives a CO2 reduction of 81%.
Overheating
Experience shows that buildings that are highly insulated are more susceptible to overheating. A ventilation strategy to reduce overheating was investigated for the distribution centre. All four strategies (see table below) are based on opening the transport doors and installing vents in the roof.
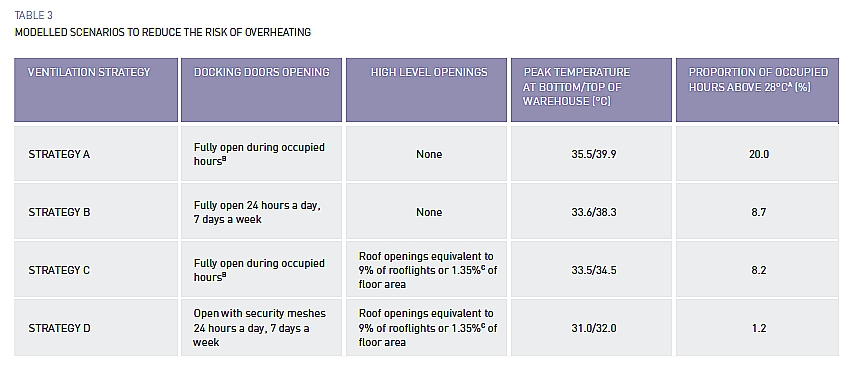
Ventilation strategies for reducing overheating.
Strategy C is the most practical. Strategy D provides better results, but is more expensive. The effect of sawtooth roofs combined with strategy C has been examined. It appears that a structure with a sawtooth roof has about the same performance (1.5% above 28°C) as the basic structure using strategy D (1.2% above 28°C).
Energy-generating techniques
Using only energy saving measures it is possible to meet the reduction requirements in Part L for 2010 (-25%), 2013 (-44%) and 2016 (-70%). For a reduction of 100% saving energy alone is not sufficient. This also applies if the use-related energy must be compensated. Then a reduction of 117% is necessary.
Energy-generating techniques are necessary to achieve these reductions. A total of 20 techniques were investigated, e.g. wind turbines, solar cells, hydropower and fermentation plants. Of the various techniques, only wind and solar were able to generate sufficient energy. The table below shows which combination of package with energy-generating techniques form an economical way of complying with Part L.
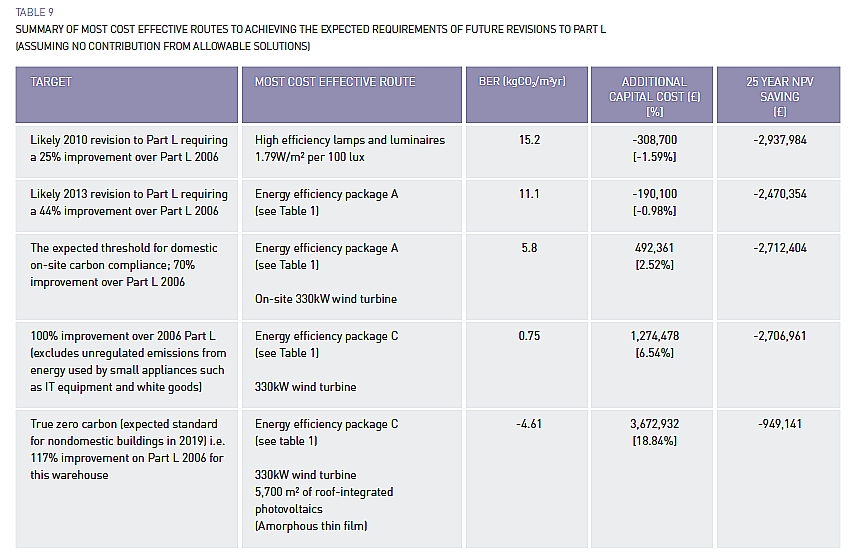
Combinations of energy-saving package with energy-generating technology that meet the requirements of Part L.
The table shows that with an additional investment up to 2.52%, 70% savings of CO2 emissions can be achieved. In addition this generates 2.5 to 2.9 million. This enables the distribution centre to meet the 2016 requirements. To make all building-related energy neutral (100%) an additional investment of 6.54% is needed.
The entire report is available in the download section.